ANET $170 Call Expiring September 18th 2026
(Arista Networks, Inc., $170 Call Expiring Sept 18th 2026)
Created: March 2026 | Last Updated: April 8th 2026
1️⃣ Trade Snapshot
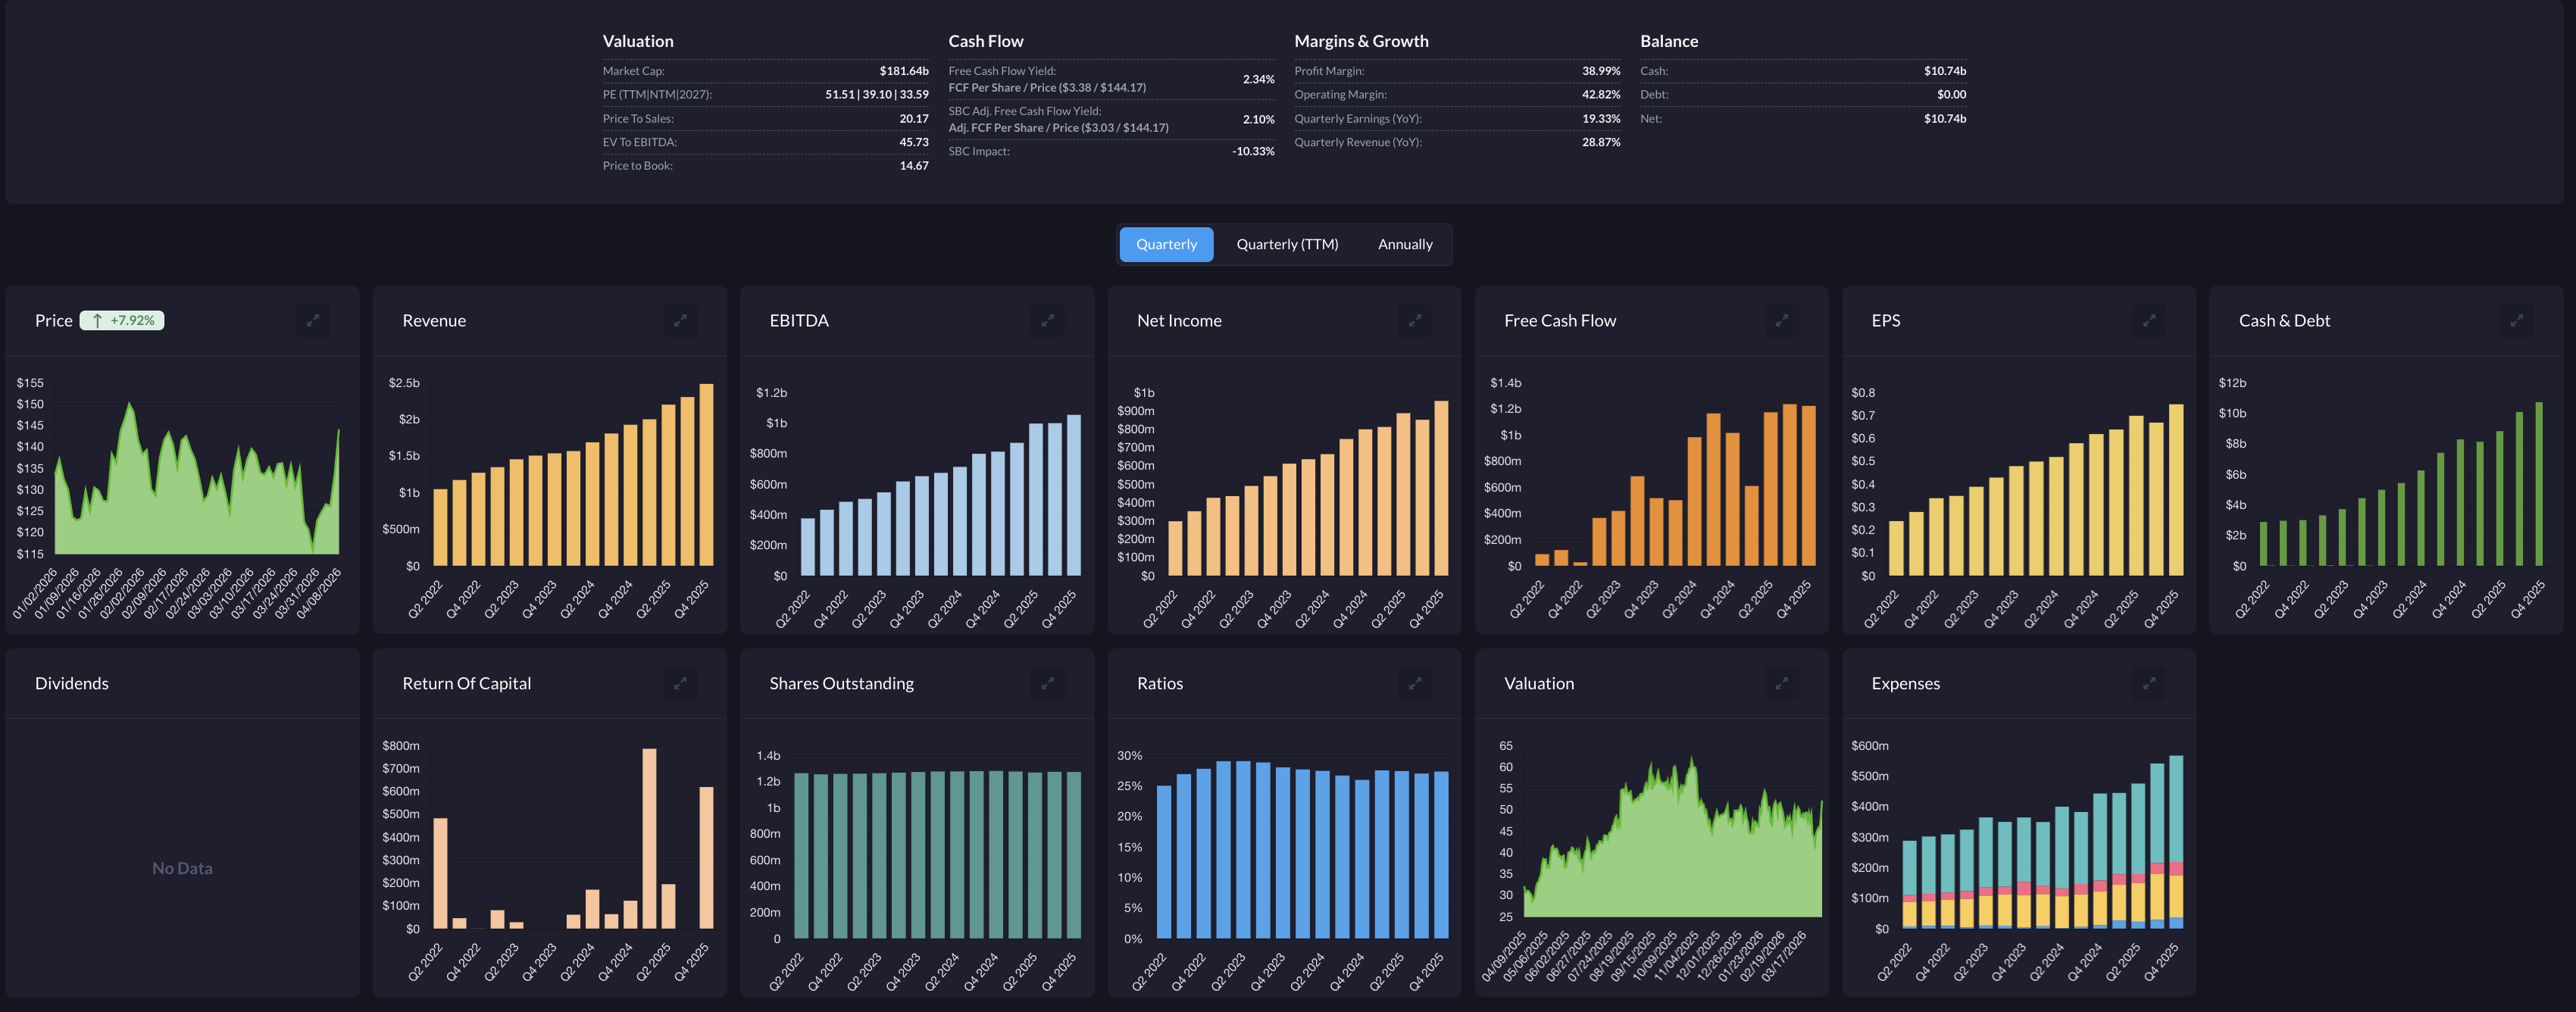
The company. Arista Networks (ticker: ANET) designs and sells high-performance cloud networking equipment, specifically the switches, routers, and software that move data between servers inside hyperscale data centers, AI training clusters, and enterprise campus environments. When thousands of GPUs need to communicate with each other during AI model training, Arista's networking hardware is what connects them. Its major customers include Microsoft, Meta, Google, and Amazon. The company runs all its hardware on a unified operating system called EOS (Extensible Operating System), which creates high switching costs and keeps customers on the platform once deployed. FY2025 revenue hit $9.01B (+29% YoY) with 2026 guidance of ~$11.25B (+25%).
The trade type. This is a value + catalyst/momentum trade. The value side: the stock has pulled back roughly 15-25% from its highs while the business continues to accelerate, creating a gap between price and intrinsic value. The catalyst/momentum side: there are two earnings reports (May 5 and early August) before expiration that could reprice the stock higher, and ANET's beta of ~2.1 means it moves meaningfully on macro risk-on rotations. The long expiration gives the thesis time to develop across multiple data points.
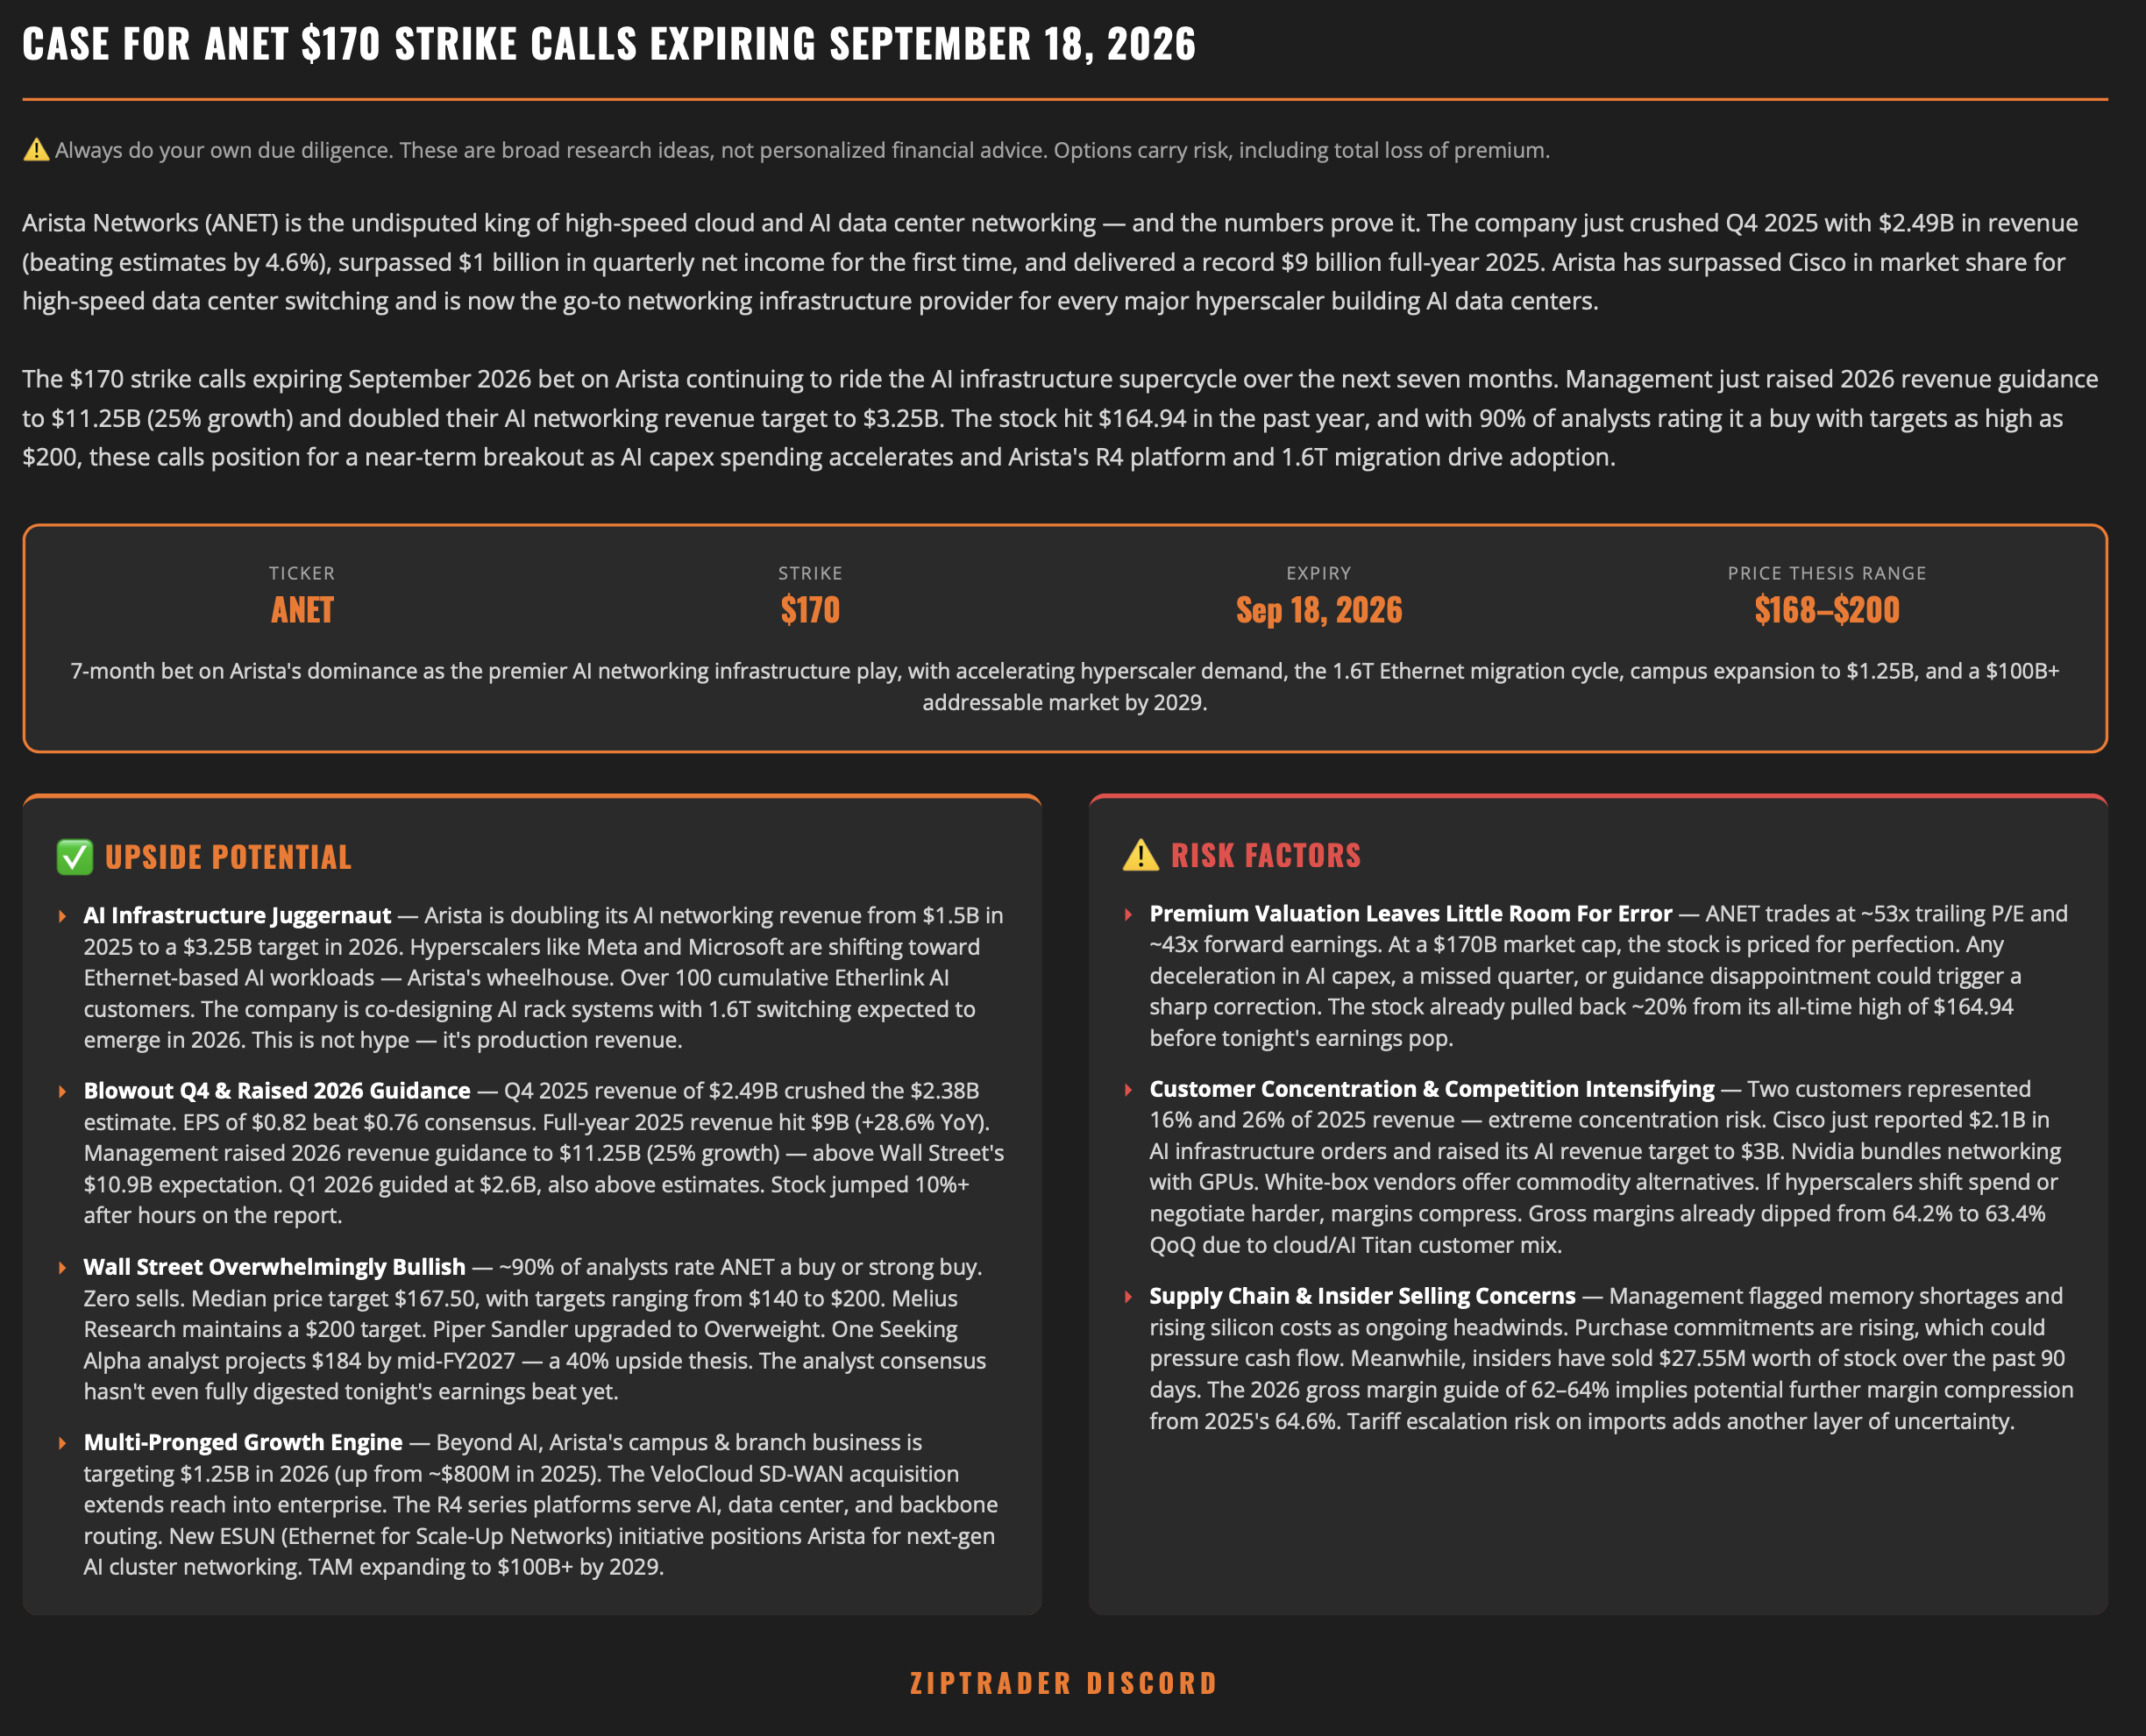
What is this trade? You are buying a call option on ANET at a $170 strike price, expiring September 18, 2026. This gives you the right to buy ANET shares at $170 each before that date. You pay a premium upfront for that right. If the stock rises well above $170, specifically above your breakeven (~$184), you profit. If it doesn't, you lose some or all of the premium you paid, but that's the most you can lose.
Price range at time of writing (April 8, 2026): ~$122-$141 per share.
How far does the stock need to move? About 21-39% to reach the $170 strike, and about 30-51% to reach breakeven at ~$184. The stock has a 52-week range of ~$67 to ~$165, and moved ~55% in a single quarter before (Q4 2024 into Q1 2025). With two earnings catalysts inside the window, a beat-and-raise cycle could generate a meaningful portion of the required move.
Why this trade? The stock appears undervalued relative to what the business is worth. Revenue is guided to grow ~25% in 2026, AI networking revenue is targeted at $3.25B (up from $750M in 2024), free cash flow was ~$4.25B in FY2025, and purchase commitments rose 42% quarter-over-quarter in Q4 2025. Despite all of this, the stock has pulled back significantly from its highs due to broader tariff fears, AI capex uncertainty, and macro risk-off rotation, not because the business deteriorated. Q4 2025 delivered a beat on both revenue and EPS, and 2026 guidance was raised.
What's the most you can lose? The premium you pay to buy the option. Nothing more. This is a defined-risk trade.
When does this trade stop making sense? The trade is no longer valid if: (1) the May 5th earnings report shows AI revenue deceleration or weak forward guidance, (2) hyperscaler customers meaningfully cut AI capex plans, (3) gross margins compress below 60% without a clear temporary explanation, (4) the stock stays below $120 heading into July with no signs of recovery, or (5) the broader AI infrastructure thesis weakens materially. If any of these happen, the plan is to cut losses rather than hope for a turnaround. Also, if the stock rallies meaningfully before the May 5th earnings and the position is profitable, the default plan is to sell before the report to lock in gains and avoid IV crush.
Valuation Summary
| Scenario | Fair Value Range (per share) | Upside from ~$117 |
|---|---|---|
| Conservative | $130 - $165 | +11% to +41% |
| Base | $160 - $206 | +37% to +76% |
| Bull | $174 - $226 | +49% to +93% |
The breakeven for this option (~$184) sits inside the base-to-bull valuation range. This means the trade requires continued execution rather than simple mean reversion. However, intrinsic value clusters broadly between $160 and $200 under reasonable assumptions, and the stock at its current price range trades well below even the conservative midpoint.
Analyst Price Targets
| Metric | Value |
|---|---|
| Average target | ~$176 |
| Range | $140 - $220 |
| Consensus rating | Strong Buy (~26 Buy / 3 Hold / 0 Sell) |
| Implied upside from ~$130 | ~+35% to average target |
The majority of analysts have price targets at or above the $170 strike. The average target of ~$176 sits above the strike, meaning Wall Street consensus supports the stock reaching this level within 12 months.
Key Dates & Numbers
| Item | Detail |
|---|---|
| Strike price | $170 |
| Expiration | September 18, 2026 |
| Breakeven at expiration | ~$184 |
| Entry premium | ~$14.00 (as of trade creation) |
| Next earnings | May 5, 2026 (Q1 FY2026) |
| Following earnings | ~Early August 2026 (Q2 FY2026) |
| Stop loss | 30% of entry premium |
| Take profit | 30% of entry premium |
Notable Analyst Price Targets
| Analyst / Firm | Rating | Price Target | Notes |
|---|---|---|---|
| Morgan Stanley (Meta Marshall) | Overweight | $220 | Most bullish on the Street |
| Goldman Sachs | Buy | $200 | |
| Needham (Ryan Koontz) | Buy | $185 | Reiterated post-Q4 2025 earnings |
| Rosenblatt (Mike Genovese) | Buy | $180 | Upgraded, raised from $165 |
Where to Find More Detail
- Section 2 (Overall Assessment) - High-level conclusion, conviction level, and key dependencies.
- Section 3 (Risk Management) - Stop loss rules, exit triggers, and how to manage the position around earnings.
- Section 4 (Valuation Assessment) - Full DCF model breakdown, analyst target details, and how the strike price relates to fair value.
- Section 5 (Catalyst Thesis) - Earnings catalysts, structural growth drivers, and macro context.
- Section 6 (Strike Structure) - Why $170 was chosen, what the tradeoffs are, and how the option behaves as the stock moves.
- Section 7 (Volatility Context) - Historical volatility, IV setup, and what the current environment means for a long call.
- Section 8 (Rule of 40 & Long-Term Growth) - Quality metrics and structural growth drivers beyond the trade window.
2️⃣ Overall Assessment
This is not a deep value mispricing. It is a structured, convex AI infrastructure trade on a high-quality compounder in a pullback environment.
At the current price range of ~$122-$141 (as of April 8, 2026), the stock trades well below conservative DCF fair value ( ~$130-$165) and significantly below the Wall Street consensus target ( ~$176). The Rule of 40 score of ~76 confirms this is an elite-quality business. The question is not whether Arista is a good company. The question is whether the market re-rates it within the trade window.
Conviction level: Moderate-to-High, supported by:
- Structural moat expansion (EOS, AI networking, campus).
- Quantifiable AI revenue growth ($3.25B 2026 target).
- Two earnings catalysts within the trade window (May 5 and early August).
- Compressed valuation relative to fundamental quality.
- Potential macro tailwind from declining interest rates or tariff easing.
Success depends on:
- Continued AI capex momentum from hyperscalers.
- Q1 2026 earnings confirmation (~May 5) as the first binary event.
- Q2 2026 earnings (~early August) as the second binary event and mid-trade checkpoint.
- Analyst upward revisions following earnings beats.
- Active position management and strict adherence to predefined risk controls.
This is a gradual repricing thesis driven by AI infrastructure normalization plus potential macro multiple expansion, not a one-quarter shock event. The two earnings cycles before expiration allow time for estimate revisions and institutional accumulation.
3️⃣ Risk Management & Exit Framework
Position Parameters
- Entry premium: ~$14.00 (as of trade creation, option pricing changes over time)
- Stop loss: 30% ↓ of entry premium
- Take profit: 30% ↑ of entry premium
If the option trades at or below 30% of entry, exit immediately to preserve capital.
Additional Rules
- Full exit if premium reaches 2x entry (~$28+) rapidly.
- Exit within 5 trading days if earnings invalidate the AI revenue acceleration thesis.
- Immediate exit if guidance weakens or margin expansion fails.
- If the stock has rallied meaningfully before the May 5th earnings and the position is showing a profit, sell before the earnings date. Option premiums typically drop sharply right after earnings regardless of direction (IV crush). Locking in gains before earnings avoids giving back profits to post-earnings premium compression. The exception would be if you have strong conviction that the earnings result will drive a move large enough to more than offset the IV crush, but the default plan should be to take profits pre-earnings if they are available. Apply the same logic before the August earnings report.
Exit Discipline
- Harvest gains into strength rather than holding for theoretical expiration value.
- Reevaluate after each earnings release (May 5, then early August).
- Exit immediately if the AI capex narrative weakens materially.
- Do not allow thesis drift. If the fundamental picture changes, exit regardless of where the premium sits.
- Discipline is essential due to the convex structure and reliance on continued execution.
4️⃣ Valuation Assessment
DCF Summary
Price range at time of writing (April 8, 2026): ~$122-$141 | Shares: ~1.28B diluted | Net cash & investments: ~$10.1B | FY2025 Revenue: ~$9.01B | FY2025 Non-GAAP FCF: ~$4.25B
At the current price range (as of April 8, 2026), ANET has pulled back ~15-25% from its 52-week high of ~$165, compressing the multiple despite no deterioration in the underlying business. Q4 2025 delivered a beat on both revenue and EPS, 2026 guidance was raised, and AI networking demand was described as "unprecedented" by CEO Jayshree Ullal.
Conservative Scenario (Stage 1: 15% · Stage 2: 8% · Terminal: 2%)
| Discount Rate | Equity Value | Fair Value / Share | Upside vs ~$117 |
|---|---|---|---|
| 8% | ~$211B | ~$165 | ~+41% |
| 9% | ~$186B | ~$145 | ~+24% |
| 10% | ~$166B | ~$130 | ~+11% |
Conservative Range: $130 to $165 | +11% to +41%
Base Scenario (Stage 1: 20% · Stage 2: 10% · Terminal: 2%)
| Discount Rate | Equity Value | Fair Value / Share | Upside vs ~$117 |
|---|---|---|---|
| 8% | ~$264B | ~$206 | ~+76% |
| 9% | ~$231B | ~$181 | ~+55% |
| 10% | ~$205B | ~$160 | ~+37% |
Base Range: $160 to $206 | +37% to +76%
Bull Scenario (Stage 1: 23% · Stage 2: 10% · Terminal: 2%)
| Discount Rate | Equity Value | Fair Value / Share | Upside vs ~$117 |
|---|---|---|---|
| 8% | ~$289B | ~$226 | ~+93% |
| 9% | ~$252B | ~$197 | ~+68% |
| 10% | ~$223B | ~$174 | ~+49% |
Bull Range: $174 to $226 | +49% to +93%
Methodology: Two-stage DCF on non-GAAP free cash flow from FY2025 base of ~$4.25B. Net cash & investments of ~$10.1B added to enterprise value. Stage 1 growth rates anchored to management guidance (~25% for 2026) with moderate deceleration assumptions. Terminal growth at 2%.
These estimates suggest the stock could reasonably be worth around $160-$200 per share if the company continues executing well. At the current price range, the stock trades below even the conservative fair value midpoint (~$145), implying the market is pricing in either growth deceleration or macro risk that may not materialize.
Wall Street Consensus
12-month average price target: ~$176 (Strong Buy, ~26 Buy / 3 Hold / 0 Sell). Range: $140 to $220. Implied upside from the current price range: ~+25-44%.
Strike Positioning
The $170 strike sits within the base DCF fair value range ($160-$206). Reaching breakeven (~$184 at expiration) requires base-case execution, not an extreme outcome. The strike sits near the average analyst price target of ~$176 and is supported by the majority of analyst targets.
At the current price range of ~$122-$141 (as of April 8, 2026), the stock needs a ~21-39% move to reach the $170 strike and ~30-51% to breakeven. This is a meaningful but achievable move across two earnings cycles. ANET has moved ~55% in a single quarter before (Q4 2024 into Q1 2025). Importantly, the vast majority of analysts on the Street have 12-month targets above $160, and many exceed the $170 strike.
5️⃣ Catalyst Thesis
The trade is centered on two upcoming earnings cycles and the broader AI infrastructure repricing narrative.
Earnings Catalysts
Q1 2026 Earnings (~May 5, 2026)
The next scheduled report. Q4 2025 delivered EPS of $0.82 (beating $0.76 consensus) and revenue of $2.49B (+29% YoY, beating $2.38B consensus). Q1 2026 guidance was set at $2.6B revenue with 62-63% gross margin and ~46% operating margin.
Key items to watch:
- Revenue beat vs. $2.6B guide. Consensus is ~$2.61B, so a meaningful beat would need to exceed $2.65B+.
- AI networking revenue trajectory toward the $3.25B 2026 target.
- Gross margin stability at 62-63% despite mix shifts.
- Any forward guidance raise for full-year 2026 revenue (currently ~$11.25B / +25%).
Arista has beaten EPS estimates for 8 consecutive quarters. A continued beat-and-raise cadence would support both multiple expansion and institutional accumulation.
Q2 2026 Earnings (~Early August 2026)
Falls within the trade window (September 18 expiry). This is the second catalyst and provides a mid-trade checkpoint. By Q2, the AI networking ramp should be more visible in reported numbers, and any 1.6T migration cycle early signals would be incrementally positive.
Structural Catalysts
- Management guidance of ~25% revenue growth for 2026 (~$11.25B), with AI networking revenue target increased to ~$3.25B (from $2.75B prior).
- Structural AI capex acceleration. Microsoft, Meta, Google, and Amazon have all guided for record data center spending. Arista's switches are foundational to the GPU cluster networking layer.
- R4 platform and 1.6T migration cycle. Arista's next-generation switching platform positions it for the 800G to 1.6T transition cycle beginning in late 2026/2027, extending the growth runway beyond current estimates.
- Purchase commitments up 42% QoQ as of Q4 2025, a forward-looking demand indicator that supports the revenue acceleration narrative.
- Free cash flow strength. ~$4.25B in FY2025 FCF provides capacity for share repurchases, strategic investments, and balance sheet optionality.
Macro Context
- A potential shift toward a less risk-off macro environment (declining interest rates, tariff easing) would support multiple expansion across high-quality growth infrastructure names.
- Lower rates improve equity duration dynamics, increase appetite for AI-linked growth assets, and reinforce institutional flows into companies with visible multi-year earnings growth.
- ANET has a beta of ~2.1, meaning it moves meaningfully on macro risk-on rotations.
There are two earnings cycles before expiration, allowing time for estimate revisions and institutional accumulation. This is a gradual repricing thesis driven by AI infrastructure normalization plus potential macro multiple expansion, not a one-quarter shock event.
6️⃣ Strike Structure
- Strike: $170
- Breakeven at expiration: ~$184 (strike + ~$14 premium)
- Required move from the current price range (~$122-$141 as of April 8, 2026): ~21-39% to $170 / ~30-51% to breakeven
- Delta: ~0.41
- Premium: ~$14.00 (as of trade creation)
- Days to expiration (from creation): ~171
This is a convex, OTM (Out of the Money) structure (sub-0.55 delta), appropriate for a thesis-driven trade with multiple catalysts inside the window.
The breakeven (~$184) exceeds base-case intrinsic value at the mid-discount rate and sits within the bull-case range. This means the trade requires continued execution rather than simple mean reversion.
Key implications:
- The position does not require holding to expiration. Gains may be realized earlier as intrinsic value builds and delta increases with price acceleration. A strong Q1 earnings beat (May) that moves ANET to $135-$145 would significantly increase the option's value.
- Theta decay is manageable at this delta level. Time decay is partially offset by stock movement, unlike a deep OTM (Out of the Money) structure where theta dominates.
- Vega remains a meaningful contributor. An IV expansion event (strong earnings, macro catalyst) can increase the option's value even without the stock reaching the strike.
- Active management around earnings events is essential. If the position is profitable heading into May 5th earnings, the default plan should be to sell before the report to avoid IV crush (see Section 3, Additional Rules). Apply the same logic before the August earnings.
- The September expiry provides ample runway through two full earnings cycles. This is the key structural advantage of the trade.
Compared to the $150 strike alternative:
- The $170 strike has a lower premium (~$14 vs. higher cost at $150), meaning less capital at risk.
- The tradeoff is a higher breakeven (~$184 vs. ~$162-$164) and lower delta (~0.41 vs. ~0.30-0.35), meaning the position requires a larger move to profit and is less responsive to smaller moves in the underlying.
- The $170 strike is better suited for a scenario where you expect a strong multi-quarter re-rating rather than a modest recovery.
- The $150 strike is better if you want higher probability of profit with more capital at risk; the $170 strike is better if you want more leverage per dollar with a lower probability of reaching breakeven.
7️⃣ Volatility Context
- ANET 52-week range: ~$67 to ~$165
- The stock has pulled back ~15-25% from its all-time high but remains well above its 52-week low
- Beta: ~2.1, high-beta relative to the broader market
- IV30 percentile: ~33% (low relative to 52-week range, as of trade creation)
- Front-month IV: ~62%
- Target expiration IV (Sept 2026): ~50%
- Two earnings events (May and August) fall within the trade window, providing natural IV expansion opportunities
Implied volatility is reasonable and not elevated. The long-dated contract is not pricing extreme uncertainty, and the term structure is healthy. This is a favorable volatility regime for establishing convex exposure.
The volatility setup favors the long side if the current selloff is macro-driven (tariffs, rate uncertainty) rather than fundamental. Arista's Q4 beat-and-raise and record purchase commitments suggest the business is not decelerating. The multiple is simply compressing alongside the broader AI infrastructure sector.
8️⃣ Rule of 40 & Long-Term Growth
Rule of 40
A useful lens for evaluating growth companies is the Rule of 40, which combines revenue growth and free cash flow margin into a single quality score. If the total exceeds 40, the company is generally considered financially strong, balancing growth and profitability effectively.
Recent Arista metrics (FY2025):
- Revenue growth: ~29%
- Free cash flow margin: ~47%
- Rule of 40 score: ~76
This is an exceptionally strong score. Companies scoring above 60 are rare; above 70 is elite territory. It indicates Arista combines rapid growth with outstanding capital efficiency. Most enterprise infrastructure companies that sustain Rule of 40 scores above 60 tend to trade at premium multiples. Arista's current multiple compression despite a score near 76 suggests the market is either pricing in macro/cyclical risk or temporarily mispricing the stock relative to its fundamental quality.
Long-Term Growth Drivers
Several structural trends support Arista's multi-year growth runway beyond the near-term trade window:
- Cloud expansion. Hyperscale cloud providers continue expanding capacity at an accelerating pace. Microsoft alone has guided for $80B+ in data center capex for 2025/2026. Every new rack needs network connectivity.
- AI infrastructure buildout. AI training clusters require ultra-high-bandwidth, low-latency networking between thousands of GPUs. Arista's AI networking revenue target of $3.25B for 2026 (up from $750M in 2024) reflects the early stages of a multi-year buildout cycle. The transition from 400G to 800G and eventually 1.6T creates recurring upgrade cycles.
- Data center modernization. Legacy enterprise and service provider networks are being replaced with modern, software-defined architectures. This provides a steady baseload of demand independent of the AI cycle.
- Network automation via EOS. Arista's unified operating system enables operators to manage extremely large networks with fewer engineers and less downtime. As networks grow to hundreds of thousands of ports, this operational advantage deepens the competitive moat and creates switching costs that keep customers on the platform.
Management expects continued growth driven by demand from hyperscale cloud customers, with visibility extending into 2027+ through the 1.6T product cycle and expanding enterprise campus adoption.