Itron makes the smart meters and the software that run them for electric, gas, and water utilities, with about 100 million networked devices deployed worldwide. A cyberattack scare knocked the stock from about $142 down to ~$81, and while the business has become much more profitable, a close look at the cash flow shows much of that improvement was one-time, so today's price is closer to fair than the headline drop suggests.
Catalysts
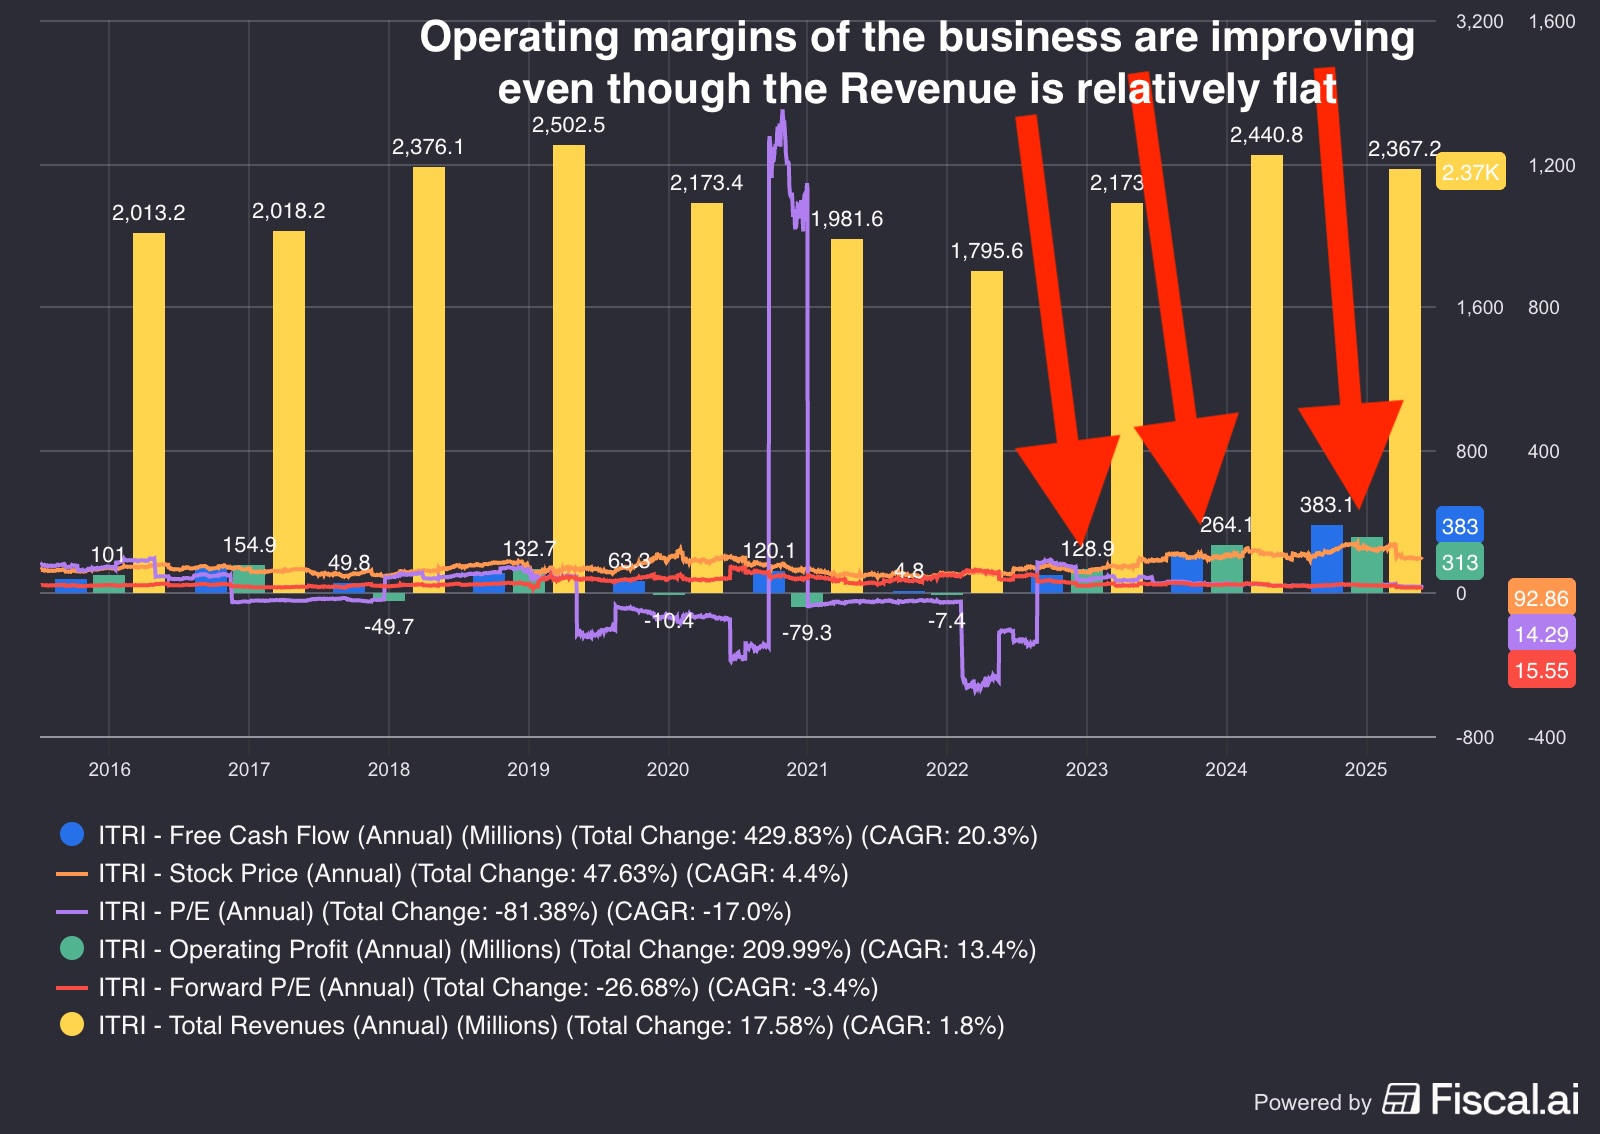
Sales finally growing again (the core one): Itron has become much more profitable over three years even though sales stayed flat. If sales start growing, and there is plenty of room since only 16 million of its 100 million meters are the new smart kind, profits can jump because the business is now much leaner. This upgrade cycle does not depend on AI. The honest note: it has not started yet, and the company's Q2 2026 guidance is for sales to fall about 7-8% from a year earlier.
The NVIDIA deal turning into real money: Itron is putting NVIDIA's AI technology into its meters (the Jetson integration was demonstrated in May 2026). If they start charging for it, the market would likely stop treating Itron as a boring meter maker and value it more like a tech company, which usually means a higher stock price. This is the main path to the re-rating that the disciplined model does not assume.
The software side getting big enough to matter: Itron's recurring software revenue reached about $400 million a year (up 28%), helped by recent acquisitions. Once recurring software passes roughly a quarter of total revenue, investors tend to value the whole company more generously.
Big investors showing they held on (mid-August): Several notable holders bought in before the April cyberattack, including Norway's Norges Bank (2025) and the Soros fund (late 2025). In mid-August, large investors must publicly report whether they kept their shares. Holding through the attack would remove an overhang. The company is also buying back stock, which supports the price.
A steady stream of replacement deals: The Auckland water-meter contract (100,000 units) is the kind of routine, AI-independent win that keeps the upgrade cycle visible even while headline growth is flat.
Key risks
The sales turnaround might not come (the dominant risk): The whole case rests on sales eventually growing again. Right now they are still shrinking: Q2 2026 is guided down about 7-8% from a year earlier, and the inflection keeps slipping. If sales stay flat or soft quarter after quarter, the "about to take off" story looks like wishful thinking, and because the stock is no longer cheap on a disciplined model, there is little valuation cushion to fall back on.
It is not the bargain it looks like: Once the one-time boosts are stripped out of the cash flow, today's price is roughly fair value, not a discount. Much of the upside the Street sees depends on a re-rating that has not happened. If that re-rating does not come, the stock can sit still for a long time.
Leftover fallout from the cyberattack: The April breach looks contained, but there could still be cleanup costs, higher security spending, or customers who hold off on orders, any of which would eat into the improving profits.
The NVIDIA deal is still just a promise: It is a promising partnership, but Itron has not said how, or how much, it will charge. Until real money shows up, it is a story rather than income.
Insiders selling and one bearish analyst: Several executives have sold shares (through pre-scheduled plans, so not alarming on its own), and at least one analyst sits well below the others on price.
Portfolio position
5.8% of TFSA+4.66%
Itron (ITRI) Investment Evaluation Brief
Last updated: June 29, 2026
Price at writing:~$81 (June 29, 2026); recently swinging between $80 and $83, so treat the exact entry as a moving target
Market cap: ~$3.6B
Sector: Quality Industrial
Layer: Power Delivery and Grid Infrastructure (grid intelligence and software)
Conviction: Medium (weighted score 3.73 / 5.0; Medium verdict tier; expected hold 3-5 years)
Verdict: Buy under ~$95, double down under ~$80. At ~$81 it sits just above the double-down line, so it is an active but not aggressive buy. On a disciplined cash-flow model the stock is roughly fairly valued at today's price, not a deep bargain, so this is a bet on a revenue inflection and a re-rating, backed by a strong moat, rather than a clear discount today.
Itron makes the smart meters and the software that run them for electric, gas, and water utilities, with about 100 million networked devices deployed worldwide. A cyberattack scare knocked the stock from about $142 down to ~$81, and while the business has become much more profitable, a close look at the cash flow shows much of that improvement was one-time, so today's price is closer to fair than the headline drop suggests.
1️⃣ Summary/Snapshot
Itron is a "boring" meter maker whose profits climbed sharply while revenue stayed flat, which sets up a re-rating if sales finally grow. But the cash-flow surge that made it look cheap was largely one-time, so the easy discount is gone and the case now rests on the turnaround actually arriving. buy under ~$95, double down under ~$80.
The plan:
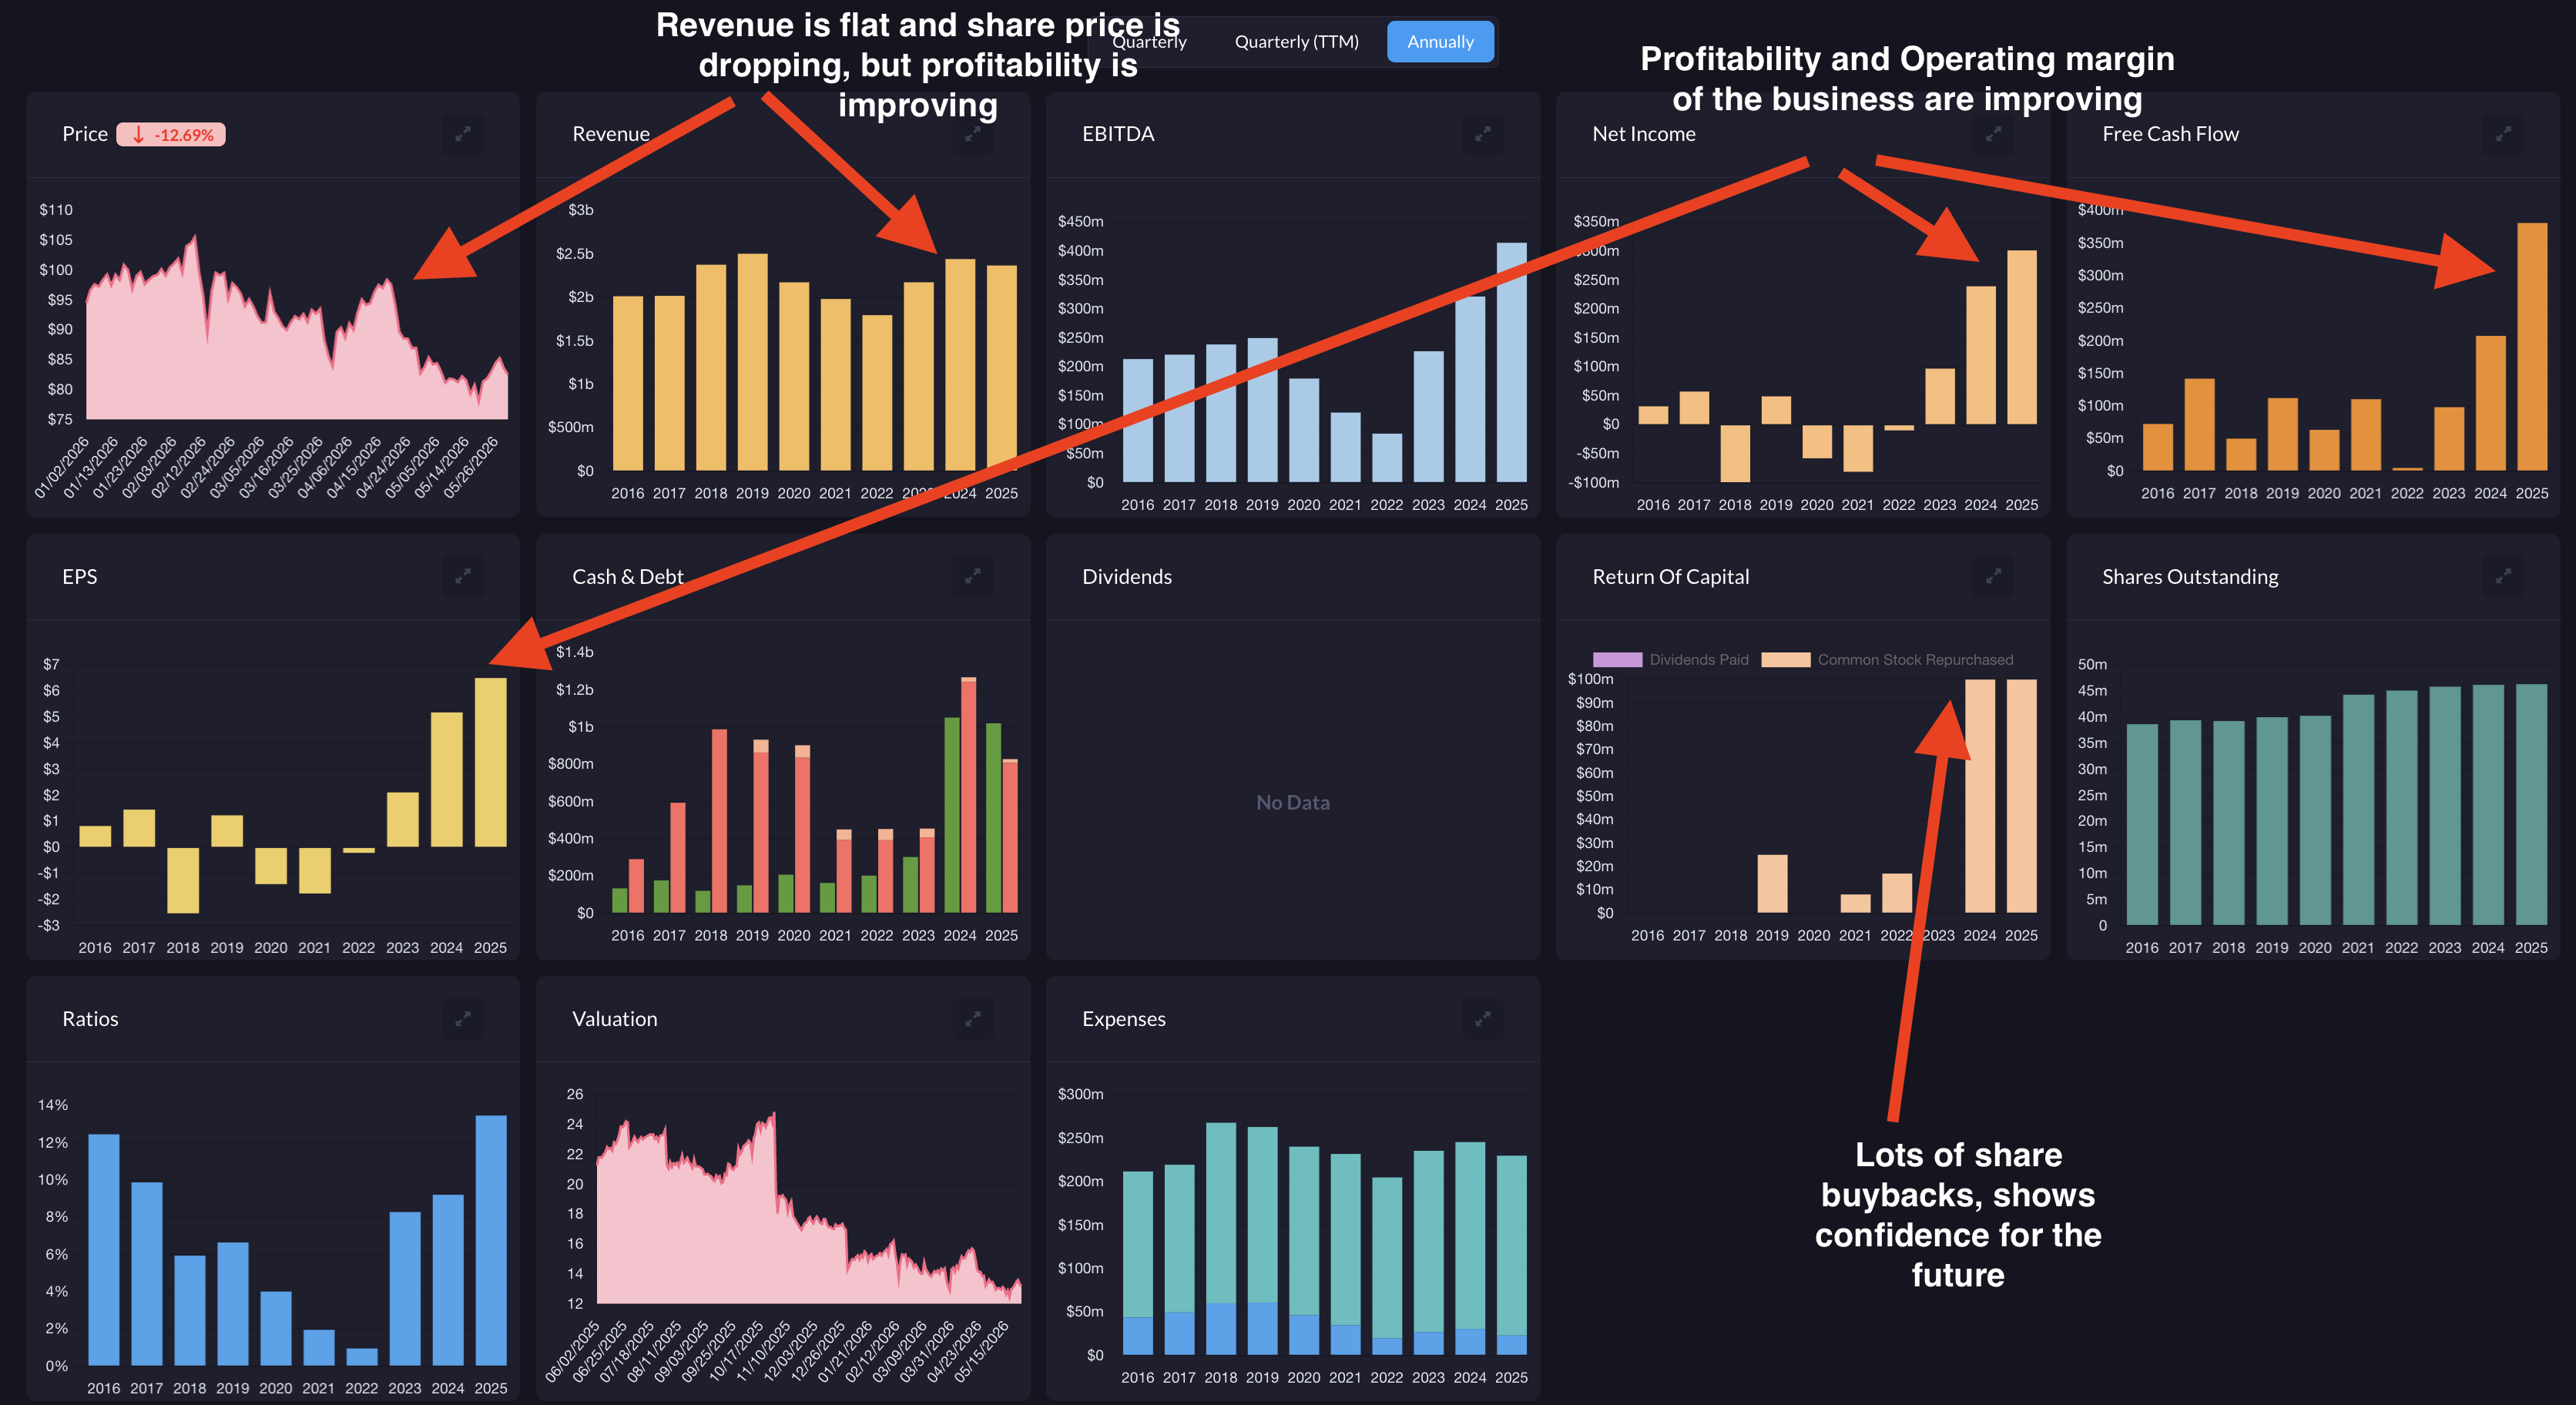
Hidden-value setup, with a caveat: Over three years Itron's margins expanded dramatically on flat revenue, so the business is much leaner, and if revenue inflects (only 16 million of its 100 million meters are the new smart kind), earnings and the valuation multiple can rise together. The caveat: FY2025 free cash flow was inflated by a one-time working-capital release, low cash taxes, and a capex trough, so the honest base is lower (~$320M, not the ~$383M reported), and that lower base is what makes today's price look fair rather than cheap.
It does NOT need the AI boom to work: The core growth driver is utilities replacing aging meters with smart ones on a multi-year cycle, which happens regardless of AI. A new deal to replace 100,000 mechanical water meters in Auckland is a clean example. That lowers Itron's exposure to a broad slowdown in AI spending. The AI angle (putting NVIDIA chips in meters) is extra upside, not the foundation.
Roughly fairly valued today: Bear/base/bull fair values run about $58-80 / $78-109 / $98-138, with a probability-weighted fair value near $79 at a conservative discount rate (about $92 at a slightly less conservative one). At ~$81 the stock is near the middle of that range. The upside lives in the bull case and in a software-style re-rating that the model deliberately does not assume.
Owned almost entirely by institutions (~96%): Big holders include Vanguard and BlackRock, with active buyers like Norway's sovereign wealth fund (Norges Bank, 2025) and the Soros fund (late 2025). The mid-August 13F filings will be the first clear read on whether they held through the April cyberattack.
At a Glance
Item
Detail
Verdict
Buy < ~$95 · Double down < ~$80
Current price
~$81 (June 29, 2026)
Base-case fair value
~$78-109 (-4% to +35% vs ~$81, June 29)
Probability-weighted fair value
~$79 at 11% discount (-2% vs ~$81); ~$92 at 10% (+14%)
Analyst target (avg / median)
~$126 / ~$130 (+56% / +60% vs ~$81, June 29)
Moat
Strong (100M-endpoint installed base; high switching costs)
Inflection not arriving; Q2 2026 guided revenue down ~7-8% YoY
Next earnings
July 30, 2026 (Q2)
Valuation Summary
Scenario
Fair Value / Share
vs ~$81 (June 29)
Conservative
~$58 - $80
-28% to -1%
Base
~$78 - $109
-4% to +35%
Bull
~$98 - $138
+21% to +70%
Valued on a two-stage discounted-cash-flow model with a Gordon-growth terminal, on a normalized ~$320M cash-flow base (the FY2025 reported figure was inflated by one-time items, so it is not extrapolated). See Section 6.
Notable Analyst Price Targets
Firm
Rating
Price Target
Date / Notes
TD Cowen
Buy
$130
Lowered from $145, April 2026
Needham
Buy
$124
2026
J.P. Morgan
Buy
n/a
Reiterated Buy, May 2026
Average
Buy
~$126
~10 Buy / 1-2 Hold / 1 Sell
Median
n/a
~$130
Street range
n/a
$112 - $145
One lone Sell at the low end
Where to Find More Detail
Section 4 (Plain-English): What Itron does and the meter-upgrade and AI angles.
Section 6 (Quantitative): Consensus targets, the cash-flow model, the normalization, and the gap to the Street.
Section 7 (Six-Category Evaluation): The scored framework behind the Medium rating.
Section 8 (Strategy): The buy and double-down rules.
2️⃣ Catalysts
Sales finally growing again (the core one): Itron has become much more profitable over three years even though sales stayed flat. If sales start growing, and there is plenty of room since only 16 million of its 100 million meters are the new smart kind, profits can jump because the business is now much leaner. This upgrade cycle does not depend on AI. The honest note: it has not started yet, and the company's Q2 2026 guidance is for sales to fall about 7-8% from a year earlier.
The NVIDIA deal turning into real money: Itron is putting NVIDIA's AI technology into its meters (the Jetson integration was demonstrated in May 2026). If they start charging for it, the market would likely stop treating Itron as a boring meter maker and value it more like a tech company, which usually means a higher stock price. This is the main path to the re-rating that the disciplined model does not assume.
The software side getting big enough to matter: Itron's recurring software revenue reached about $400 million a year (up 28%), helped by recent acquisitions. Once recurring software passes roughly a quarter of total revenue, investors tend to value the whole company more generously.
Big investors showing they held on (mid-August): Several notable holders bought in before the April cyberattack, including Norway's Norges Bank (2025) and the Soros fund (late 2025). In mid-August, large investors must publicly report whether they kept their shares. Holding through the attack would remove an overhang. The company is also buying back stock, which supports the price.
A steady stream of replacement deals: The Auckland water-meter contract (100,000 units) is the kind of routine, AI-independent win that keeps the upgrade cycle visible even while headline growth is flat.
3️⃣ Key Risks
The sales turnaround might not come (the dominant risk): The whole case rests on sales eventually growing again. Right now they are still shrinking: Q2 2026 is guided down about 7-8% from a year earlier, and the inflection keeps slipping. If sales stay flat or soft quarter after quarter, the "about to take off" story looks like wishful thinking, and because the stock is no longer cheap on a disciplined model, there is little valuation cushion to fall back on.
It is not the bargain it looks like: Once the one-time boosts are stripped out of the cash flow, today's price is roughly fair value, not a discount. Much of the upside the Street sees depends on a re-rating that has not happened. If that re-rating does not come, the stock can sit still for a long time.
Leftover fallout from the cyberattack: The April breach looks contained, but there could still be cleanup costs, higher security spending, or customers who hold off on orders, any of which would eat into the improving profits.
The NVIDIA deal is still just a promise: It is a promising partnership, but Itron has not said how, or how much, it will charge. Until real money shows up, it is a story rather than income.
Insiders selling and one bearish analyst: Several executives have sold shares (through pre-scheduled plans, so not alarming on its own), and at least one analyst sits well below the others on price.
4️⃣ Plain-English Business Explanation
What Itron actually does
Itron makes the smart meters and the software that run them for utilities: electric, gas, and water. When your utility measures how much power, gas, or water you use, the device doing the measuring is increasingly an Itron meter. The company has about 100 million of these deployed across more than 8,000 utility customers in over 100 countries.
The modern story is bigger than "they make meters." A traditional meter just measures usage. The newest Itron meters, called distributed-intelligence meters, are essentially small networked computers: they report usage in real time, communicate two ways with the utility, and can run software locally to make decisions on the spot. Of the 100 million meters out there, only about 16 million are this new smart type, which is the upgrade runway.
The profitability has quietly transformed. Gross margins reached record levels (about 40.7% in the most recent quarter, up from the low 30s a few years ago) as low-margin legacy contracts rolled off and the higher-margin software and services mix grew. The catch for an investor is that flat revenue plus a few one-time cash-flow tailwinds made the business look cheaper than its repeatable earnings power supports.
Business segments
Device Solutions: The physical meters and sensors (the hardware).
Networked Solutions: The communications network and base software that connect the meters and let a utility see its whole territory.
Outcomes: The higher-margin, recurring-revenue analytics software (forecasting demand, detecting theft, predicting equipment failures); revenue grew about 22% year over year in Q1 2026.
Resiliency Solutions: A newer segment from the Urbint and Locusview acquisitions, AI-driven software for infrastructure damage prediction and field operations.
How it connects to AI
Two ways, one narrow and one wider.
The narrow connection: AI data centers consume huge amounts of electricity, and utilities are scrambling to manage the load. To do that they need real-time visibility into their grids, which is exactly what Itron's 100 million networked meters provide. As data centers stress the grid, that visibility becomes more valuable, pushing utilities to upgrade.
The wider connection: Itron's smart meters can run AI locally. The NVIDIA partnership puts NVIDIA's AI software onto Itron's meters, so each meter can predict equipment failures, detect unusual usage, and help balance the grid in real time. Itron already has 100 million endpoints in place, so NVIDIA partners with it rather than building a rival network.
The important nuance: the foundation of the thesis (utilities upgrading old meters) is AI-INDEPENDENT. AI is an accelerant and a source of extra upside, not the load-bearing assumption.
Who uses it
Electric, gas, and water utilities, plus cities running smart-infrastructure programs: more than 8,000 customers across 100+ countries, from large investor-owned utilities to municipal water authorities like Auckland's Watercare.
A simple analogy
Itron is the nervous system of the power grid. The "muscles" are the power plants, transformers, and lines that generate and move electricity. Itron is the part that senses what is happening everywhere, communicates between the pieces, and helps the grid make decisions. As the grid gets bigger and more complex because of AI data-center load, the nervous system has to get much smarter, and Itron sits exactly at that point.
Why the market has not fully woken up to it
The product category looks boring; "smart meter company" sounds like 2010.
Headline revenue is still shrinking (guided down ~7-8% YoY for Q2 2026), even though the software piece grows fast.
Utility customers move slowly; procurement cycles run years, and the market is impatient.
The April 2026 cyberattack created an overhang that pushed the stock from $142 to ~$81.
It is a mid-cap (~$3.6B), in the awkward middle that many large tech investors overlook.
Key business metrics
Metric
Value
Endpoints under management
~100 million globally
Smart (distributed-intelligence) endpoints
~16 million (the upgrade runway)
Utility customers
8,000+ across 100+ countries
Annual recurring revenue (ARR)
~$400M, +28% YoY (partly from acquisitions)
Total backlog
~$4.4B (down from $4.7B YoY)
Q1 2026 adjusted gross margin
40.7% (near record)
Partnerships
NVIDIA, Microsoft, AWS, Snowflake
5️⃣ Current Data Snapshot
Pricing and valuation (June 29, 2026):
Metric
Value
Price
~$81 (June 29, 2026; recent range $80-83)
Market cap
~$3.6B
Shares outstanding
~44.3M
52-week range
$77.77 - $142.00
P/E (TTM)
~13x
Free-cash-flow yield (normalized)
~9% on the ~$320M base
Next earnings
July 30, 2026 (Q2)
Q1 2026 results (reported April 28) and guidance:
Metric
Value
Q1 2026 revenue
$587M (-3% YoY)
Q1 2026 adjusted gross margin
40.7%
Q1 2026 non-GAAP EPS
$1.49 (vs $1.52)
Q1 2026 adjusted EBITDA
$92M
Q1 2026 free cash flow
$79M (up from $67M, driven by lower tax payments)
Q1 2026 bookings
$476M
Q2 2026 guidance
Revenue $560-570M; non-GAAP EPS $1.25-1.35 (both down ~7-8% YoY at midpoint)
FY2025 revenue
~$2.40B (~-3% YoY)
FY2025 free cash flow
~$383M reported; ~$320M normalized (used in DCF)
Net debt
~$900M (total debt $1.61B, cash $713M); ~2.4x
6️⃣ Quantitative Analysis and Valuation
Analyst Ratings
Metric
Value
Consensus
Buy (about 10 Buy / 1-2 Hold / 1 Sell)
Average target
~$126 (+56% vs ~$81, June 29)
Median target
~$130 (+60% vs ~$81, June 29)
Target range
$112 (low) to $145 (high)
Reading: The board is bullish, with a tight high range and no single outlier skewing the average (the average ~$126 and median ~$130 sit close together). There is one lone Sell, worth noting but not worth overriding a 10-strong Buy majority. The important tension: the Street's ~$126 average sits far above the disciplined probability-weighted fair value here (~$79 to ~$92). That gap is not mainly about the business being sound; it is about method. The Street is implicitly paying for a software-style re-rating (a richer exit multiple), while the model below uses a perpetuity-growth terminal that does not assume that re-rating. If the re-rating comes, the Street is closer to right; if it does not, the model is.
DCF Valuation
A DCF (discounted cash flow) estimates what the business is worth today by projecting future free cash flow and discounting it back. The key judgment is the starting cash-flow base. FY2025 reported free cash flow of ~$383M was inflated by a one-time working-capital release, unusually low cash taxes, and a capex trough, and Q1 2026's free cash flow was again helped by lower tax payments. Using those figures directly would overstate the value, so the model starts from a normalized base of ~$320M.
Inputs:
Price (June 29, 2026): ~$81
Shares outstanding: ~44.3M
FY2025 revenue: ~$2.40B
Normalized free cash flow base: ~$320M (FY2025 reported ~$383M, adjusted down for a one-time working-capital release, low cash taxes, and a capex trough)
Net debt: ~$900M (subtracted from enterprise value)
Model structure: Two-stage (Stage 1 years 1-5, Stage 2 years 6-10) plus a Gordon-growth terminal
Free cash flow grew strongly over three years, but most of the FY2025 jump came from one-time items rather than durable growth, so the reported figure is NOT extrapolated; the model starts from a normalized ~$320M.
Bull assumes revenue inflects and margins hold (the upgrade cycle plus AI monetization). Base assumes modest revenue growth on the higher margin base. Conservative assumes revenue stays roughly flat on the normalized base.
Data note: FY2025 reported FCF of ~$383M (press release) differs from an aggregator figure of ~$396M and from a TTM read of ~$300M. The ~$320M normalized base should be reconciled line by line against the FY2025 10-K cash-flow statement.Valuation Summary:
Probability-weighted fair value: Weighting 20% conservative / 55% base / 25% bull at the conservative 11% discount rate gives ~$79 (-2% vs ~$81). At a 10% discount the same weighting gives ~$92 (+14%). So the honest central estimate is that the stock is roughly fairly valued to modestly cheap, well below the analyst average of ~$126, because this model does not credit a software-style re-rating.
Stock-based compensation
Itron's stock-based pay is about $66M a year, which on the normalized ~$320M base is roughly 21% of free cash flow, just over the level where it deserves a closer look. It is largely offset by share buybacks (a ~$200M authorization, with roughly $100M deployed), so net share count is flat to down and the dilution is muted in practice. For that reason the ~$320M base is kept as the working figure rather than building a separate adjusted model. As a downside lens, though, if the full SBC were charged as a cash cost (base ~$254M), fair values would fall about 20% across the board, to roughly conservative ~$46-64 / base ~$62-87 / bull ~$78-110, which would put today's price at the upper end of the base case. That is the bear's strongest valuation argument and is worth holding in mind.
Interpretation and stress test: At ~$81 the price sits near the middle of the base-case range and just above the probability-weighted fair value, so the easy margin of safety the cyberattack briefly created is mostly gone once the cash flow is normalized. The base case at a 9-10% discount and the bull case still offer real upside, and they line up with or below the analyst targets. Stress test: If the base case's revenue growth is halved (Stage 1 to ~2.5%), fair value at the conservative 11% discount falls to about $68, roughly 16% below today's price, so a slower inflection does carry downside from here. Buy lines: Buy under ~$95 (around the probability-weighted fair value at a 10% discount) and double down under ~$80 (a modest discount to that central estimate, approaching the conservative band).
7️⃣ Six-Category Evaluation
This is the scoring framework that produces the Medium conviction rating at the top. Six areas are each scored 1.0 to 5.0, then weighted using the Quality Industrial weighting, and the weighted average sets the conviction tier.
Category 1, Quantitative: 3.0
On the normalized ~$320M base the free-cash-flow yield is about 9%, still reasonable, but at ~$81 the stock trades right at its base-case fair value rather than below the conservative-to-base zone, and near-term revenue is still declining (Q2 guided down ~7-8% YoY). Stock-based comp at ~21% of normalized FCF trims the picture further. Why not higher: The cheapness that justified a 4.0 depended on a cash-flow base now shown to be partly one-time; the disciplined valuation is roughly fair, not cheap. Why not lower: A ~9% FCF yield and a healthy ~13x P/E on a high-quality, cash-generative business are not expensive either, and the analyst board sits well above the price.
Category 2, Qualitative: 3.5
Multiple converging tailwinds remain: the meter-upgrade cycle (only 16M of 100M endpoints upgraded), fast software-revenue growth, and emerging AI partnerships. Separating the legs: the revenue/volume driver (utilities replacing meters) is largely independent of the AI thesis, while the re-rate driver (being valued like a software company) leans on the AI and software story and is unproven. Why not higher: The revenue inflection keeps slipping (Q2 guides to a decline), and the AI monetization is still a promise, so the re-rate leg is speculative. Why not lower: The upgrade cycle is real and contracted into a $4.4B backlog, the margin gains are already in the numbers, and recurring revenue keeps climbing.
Category 3, Category Classification: 4.0
A quality compounder with growth-inflection optionality: a stable installed-base business with a high-growth software layer inside it. Best owned as common stock for several years. Why not higher: It is not a pure high-growth name; headline revenue is still shrinking. Why not lower: Recurring revenue, switching costs, and proven margin expansion make it a clean quality-compounder fit.
Category 4, Bottleneck/Moat: 4.5
The strongest category. Itron's 100-million-endpoint installed base creates near-monopoly positions inside individual utilities: switching vendors would cost a utility hundreds of millions and take years, and regulatory certifications across 100+ countries add another barrier. The NVIDIA, Microsoft, AWS, and Snowflake partnerships are making Itron a default integration point for grid AI. Why not higher: Real competitors exist (Landis+Gyr, Honeywell, Aclara), even if displacing Itron is very hard. Why not lower: The installed-base lock-in is one of the most durable moats in the portfolio, likely lasting 10-20+ years.
Category 5, What Could Go Wrong: 3.5
The dominant risk is the revenue inflection slipping further (Q2 guided down ~7-8% YoY), which feeds a "value trap" worry now that the valuation cushion has thinned. The April 2026 cyberattack appears contained (no customer-data access detected, operations normal), which supports this score. The meter-replacement driver is AI-INDEPENDENT, which gives partial insulation from the portfolio's dominant correlated tail risk (a broad AI-spending disappointment): a macro AI slowdown would cap the bull case but should not break the base case. Why not higher: The revenue timing is genuinely uncertain, one analyst is notably bearish, and the stock is no longer cheap enough to absorb a miss. Why not lower: The cyberattack is contained, the customer base is spread across 8,000+ utilities, and the risks are monitorable rather than existential.
Category 6, Balance Sheet Quality: 3.0
Net debt of ~$900M at ~2.4x EBITDA sits in the "manageable but elevated" band. Strong cash flow covers interest comfortably, and the leverage rose mainly from the Urbint and Locusview acquisitions, with a path to de-lever. Why not higher: 2.4x is at the higher end of comfortable, and a buyback authorization is a capital-return choice rather than a deleveraging one. Why not lower: Cash flow easily services the debt, there is no near-term refinancing crunch, and leverage should fall over 2026.
Weighted Score Calculation
Category
Score
Weight (Quality Industrial)
Contribution
1. Quantitative
3.0
20%
0.60
2. Qualitative
3.5
20%
0.70
3. Category Classification
4.0
10%
0.40
4. Bottleneck/Moat
4.5
30%
1.35
5. Risk
3.5
15%
0.525
6. Balance Sheet
3.0
5%
0.15
TOTAL
100%
3.73
Hard-fail check: No category at 1.0 in Quantitative, Risk, or Balance Sheet. No hard fail. Interpretation: 3.73 sits in the Medium tier (3.0-3.9). The moat carries the score; the drags are a now-fair valuation and a revenue line that is still declining. This is a "quality business at a fair price, waiting on a turn," not a deep-value setup.
8️⃣ Strategy
Primary instrument: Common stock, accumulated gradually (DCA). No LEAPs allocation specified for this name.
Buy under ~$95. That is roughly the probability-weighted fair value at a 10% discount, so it is "accumulate around fair value," leaning on the moat and the potential re-rating rather than on a discount today. At ~$81 it is comfortably in the buy zone.
Double down under ~$80. Roughly double the cash per buy. This is a modest discount to the central fair-value estimate and approaches the conservative band, near the 52-week low ($77.77). The genuinely deep margin-of-safety zone is lower still (low-to-mid $70s and below), so treat sub-$80 as a better-value add rather than a screaming bargain.
One pause condition: Keep buying while the revenue-inflection story stays intact. If two or more quarters show no progress on bookings or backlog conversion, pause and reassess rather than averaging into a value trap. Given the thinner valuation cushion, hold to this discipline strictly.
Holding period: 3-5 years, to let the meter-upgrade cycle and the shift toward software and AI play out.
Reduce / exit triggers:
Trigger
Action
New cyberattack disclosures materially expand the breach scope
Reduce 25-50%
Two+ quarters of flat bookings with no inflection signal
Pause adds; reassess
A major utility publicly cancels a multi-year contract
Reduce 50%+
Evidence Itron's own products have systemic vulnerabilities
Exit
Stock re-rates toward $130-145 (analyst targets) without further upside catalysts
Trim into strength
9️⃣ Open Questions
What is the exact FY2025 free cash flow per the 10-K cash-flow statement, and does it confirm the ~$320M normalized base after backing out the working-capital release, low cash taxes, and capex trough? (Reconcile the ~$383M press-release figure, the ~$396M aggregator figure, and the ~$300M TTM read.)
Does the July 30 Q2 report show bookings and backlog conversion picking up, or revenue still declining as guided?
What is the revenue model for the NVIDIA partnership (per meter, per inference), and when does it start generating real revenue, the key to the re-rating the model does not assume?
Did major institutions (Norges Bank, Soros, and others) hold their positions through the cyberattack? The mid-August 13F filings are the first read.
Is the ~$66M annual SBC trending up or down, and does the buyback continue to offset it on a net-share basis?
What methodology supports the Street's ~$126 average (presumably a software-style exit multiple), and is that re-rating assumption reasonable for a business still guiding revenue lower?
Research for personal use. Not investment advice. Verify pricing, share count, net debt, and material developments through primary sources before any transaction. The DCF is a scenario tool, not a prediction; the normalized cash-flow base, the choice of a perpetuity-growth terminal over a re-rating exit multiple, and the timing of the revenue inflection are the assumptions that move fair value the most.